
Introduction

Wall sockets supply power in the form of a 230 volt sine wave. The frequency of this sine wave is supposed to be 50 hertz. In other words, the voltage on the socket alternates between positive and negative at a rate of 50 full periods per second. (At least this is how it works in the Netherlands; many countries use different frequencies and/or voltages.)
Now, is the frequency of the sine wave always exactly 50 Hz, or
only approximately?
How big are the variations?
There are clocks, so-called synchronous clocks, that count voltage alternations to determine the passage of time.
Is the grid frequency accurate enough to keep such clocks running right?
Time for a measurement!
Measurement setup

I used an Arduino to measure the frequency of the sine wave from a wall socket. To avoid working with dangerous high voltage, I used a transformer from an old halogen lamp. The transformer is plugged into the wall socket, and the low voltage side of the transformer is hooked up to the Arduino through a resistor network. The Arduino measures the sine wave at about 4386 samples/s. Whenever it detects a rising zero-crossing edge in the sine wave, it sends a timestamp to the PC.
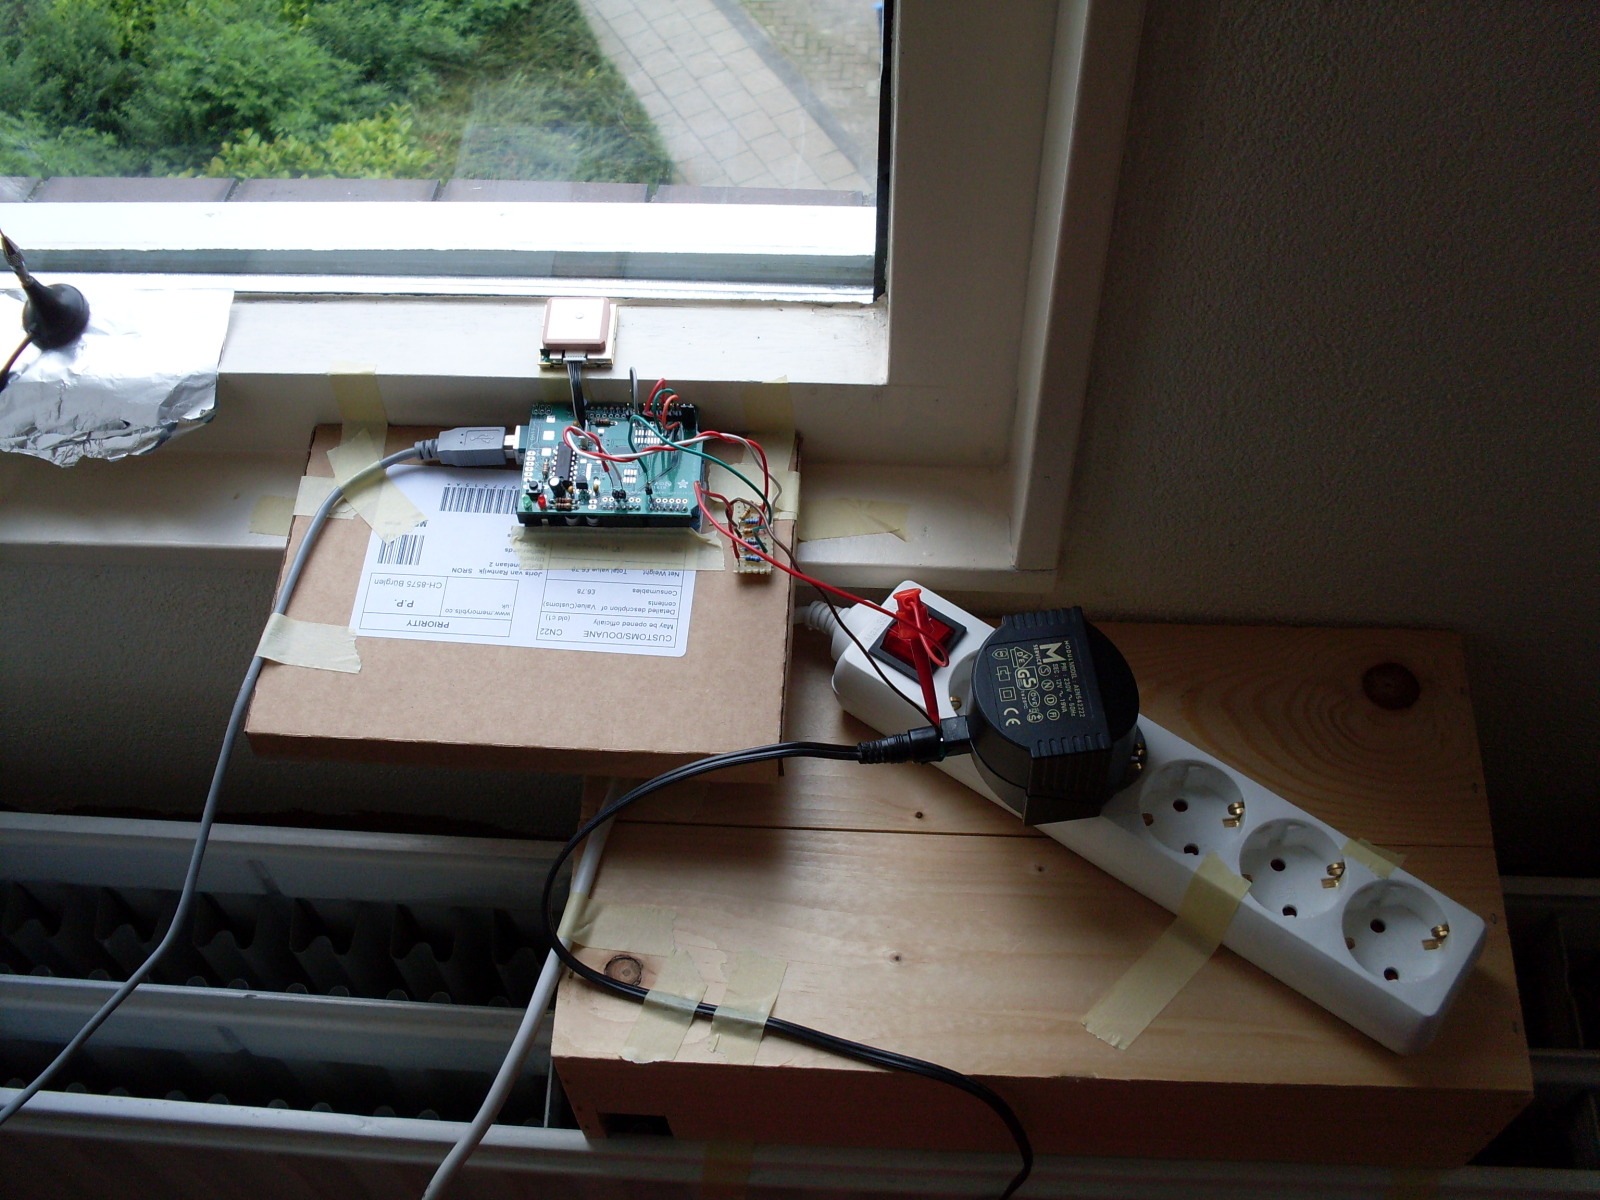
Some kind of reference clock is needed to measure the frequency of a signal. The Arduino has an on-board clock crystal but I was not sure about it's accuracy. So I decided to use a GPS receiver as my reference clock. It generates a pulse per second (PPS) with very high accuracy. The GPS receiver is connected to the Arduino by means of Lady Ada's excellent GPS shield. When the Arduino detects a time pulse from the GPS receiver, it sends a timestamp from its on-board clock to the PC. Software on the PC uses these timestamps to detect variations in the rate of the Arduino board clock.
Arduino sketch available here:
netfreq.pde
The GPS signal is not strong enough for indoor reception unless the receiver is very close to the window, so I built the test setup in the window sill. I let it run for 8 days while recording data to a file on the PC.
Results
| Measurement | 192 hours = 8 days Aug 6 00:00 to Aug 13 23:59 CEST 2010 |
|---|---|
| Average frequency (8 days) | 49.999943 Hz |
| Standard deviation | 0.0185 Hz |
| 24-hour average frequency | 49.990 - 50.005 Hz |
| Time deviation | ± 16.843 seconds |
The average frequency actually looks pretty good: 49.99994 Hz is only about 1 part-per-million away from 50 Hz. However, note that this is the average over the whole 8-day measurement. A different figure emerges when we look at the 24-hour averages. It turns out that there is significant day-to-day variation in the average frequency.
The frequency variation affects synchronous clocks. On some days the clocks run too fast, on other days they runs too slow. Although the frequency deviation is small, its effect builds up over time. A synchronous clock would have drifted up to 16 seconds away from real time during the 8-day measurement.

|

|

|

|
There are three peaks in the plot of the momentary frequency. At these points, the grid frequency jumped to almost 100 Hz for just a single period of the sine wave. I don't understand what happened there.
Since there is a relation between grid frequency and load balance (see below), I thought there may also be a relation to the voltage. However a scatter plot of voltage versus frequency does not reveal a pattern. It just looks like a typical Rorschach blob.

|

|
What is going on here
A little background reading helps to clarify these results.
Supply and demand of electrical power must always be kept in balance. This is done through a mechanism called droop speed control. The power generators in a grid are synchronous, i.e. operating at the same frequency. When demand for power increases, the generators in the grid slow down a little bit and the frequency goes down. This is detected in the power stations, and the production of the generators is increased to compensate. As a result, the frequency of the grid is kept close to 50 Hz and at the same time power production is kept in balance with power demand. A more detailed explanation can be found in this article about power grid principles.
The point is that the frequency of the grid depends on the balance between supply and demand. Although the grid operators keep the momentary frequency close to 50 Hz, they don't even try to keep the average frequency at 50 Hz. The primary purpose of frequency control is load balancing, not time keeping.
There is in fact an additional control loop to keep the long-term average frequency of the grid at 50 Hz. However, this control loop acts much slower than the primary control mechanism described above. It keeps synchronous clocks within 30 seconds of UTC. Details of this mechanism can be found on the website of ENTSOE (for the European grid).
Conclusion
The frequency of the power grid is only approximately 50 Hz. Although the long-term average frequency is extremely close to 50 Hz, there are significant day-to-day variations.
The frequency variations have a noticable effect on synchronous clocks. Synchronous clocks can be up to 30 seconds behind or ahead of real time. While this may be acceptable for typical household applications, it is not very good style. Synchronous clocks should not be used for any kind of precision time keeping.
References
- A on-line frequency meter for the UK power grid.
- Power grid principles: an article by John S. Denker about frequency and load balancing on the U.S. electric grid.
- Accuracy and stability of the 50 Hz mains frequency: a similar study of the grid frequency, but performed over a much longer period of time.
- ENTSOE: the European Network of Transmission System Operators for Electricity. Their operation handbook defines the principles of frequency control for the European power grid.
- Electrical grid on Wikipedia.